A Promised Park, Two Vacant Lots, and 1,254 Votes
TLDR: There are large waterfront lots in North Williamsburg that are zoned as public parks but are currently vacant. I conducted a data study to learn how the community can show up to advocate for change.
In 10 years of meeting notes from the local community board for North Brooklyn (Community Board 1) we can see that the way public speakers at community meetings advocate correlates with the way the board votes.
The backstory
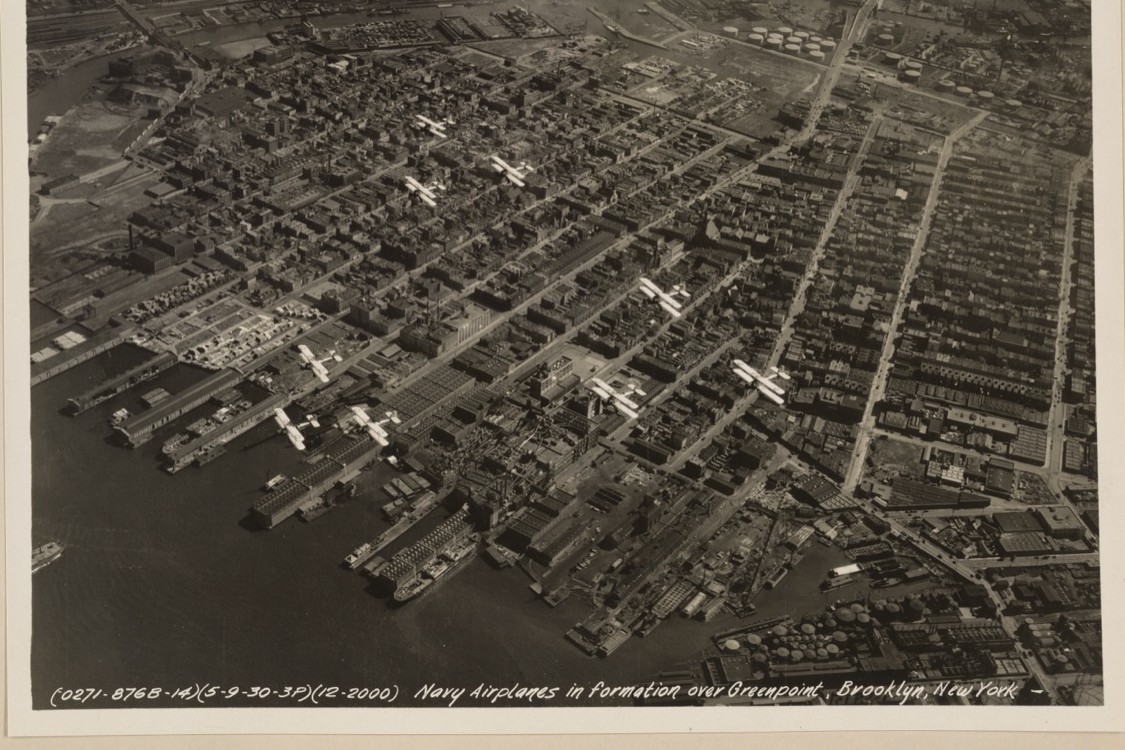

Williamsburg has become a neighborhood synonymous with gentrification. The median household income more than doubled: from $52,710 in 2000 (in 2025 dollars) to $110,480 in 2024 (Furman Center) and population grew by more than a third: from about 160k residents in 2000 to 219k in 2024 (Census, Furman Center). A poignant example: the old Domino Sugar Factory sat vacant for nearly two decades after closing in 2004, and reopened in 2023 as home to modern offices and a luxury Equinox gym.
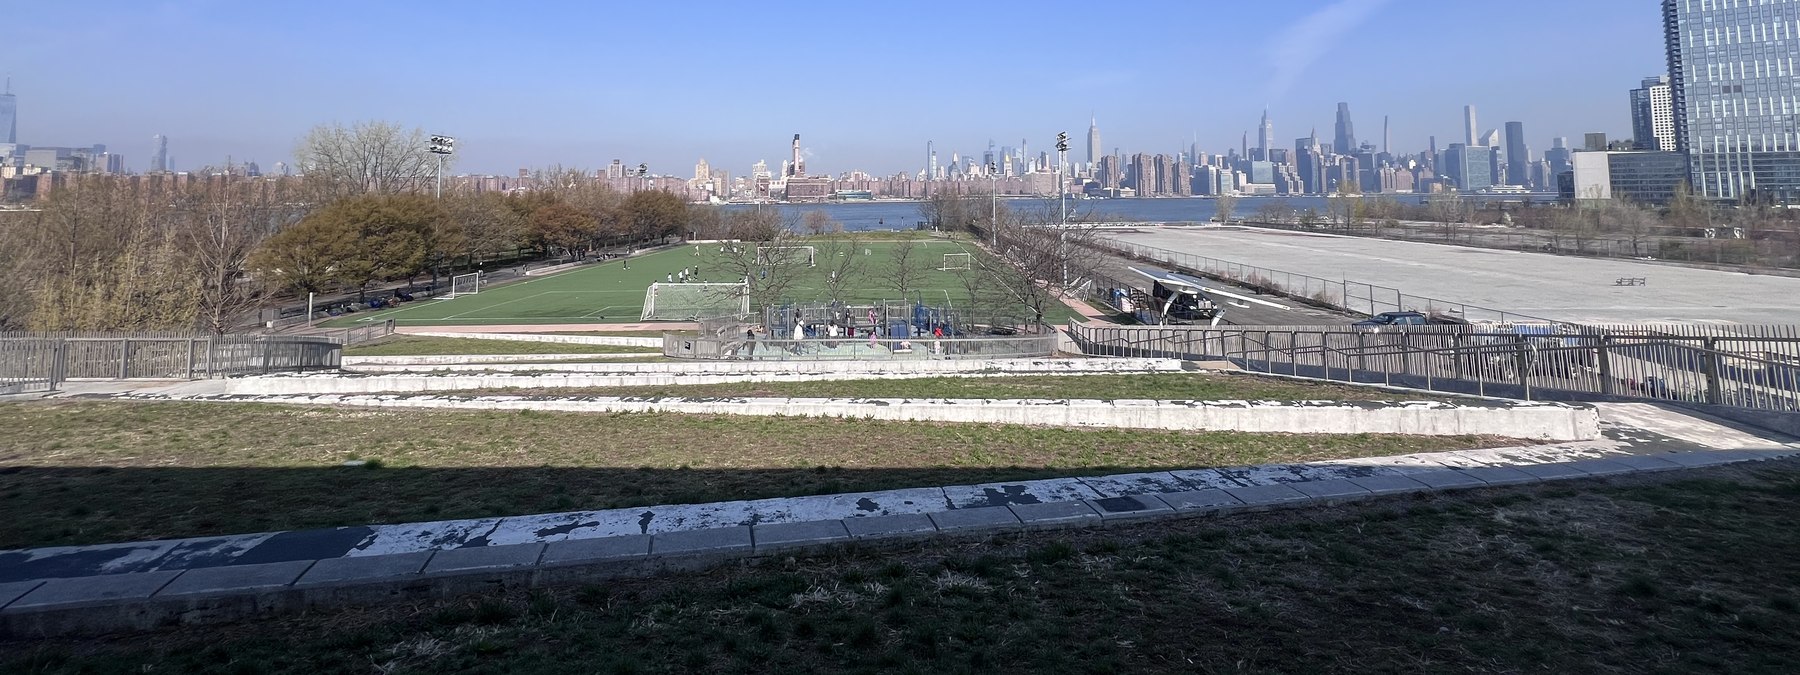
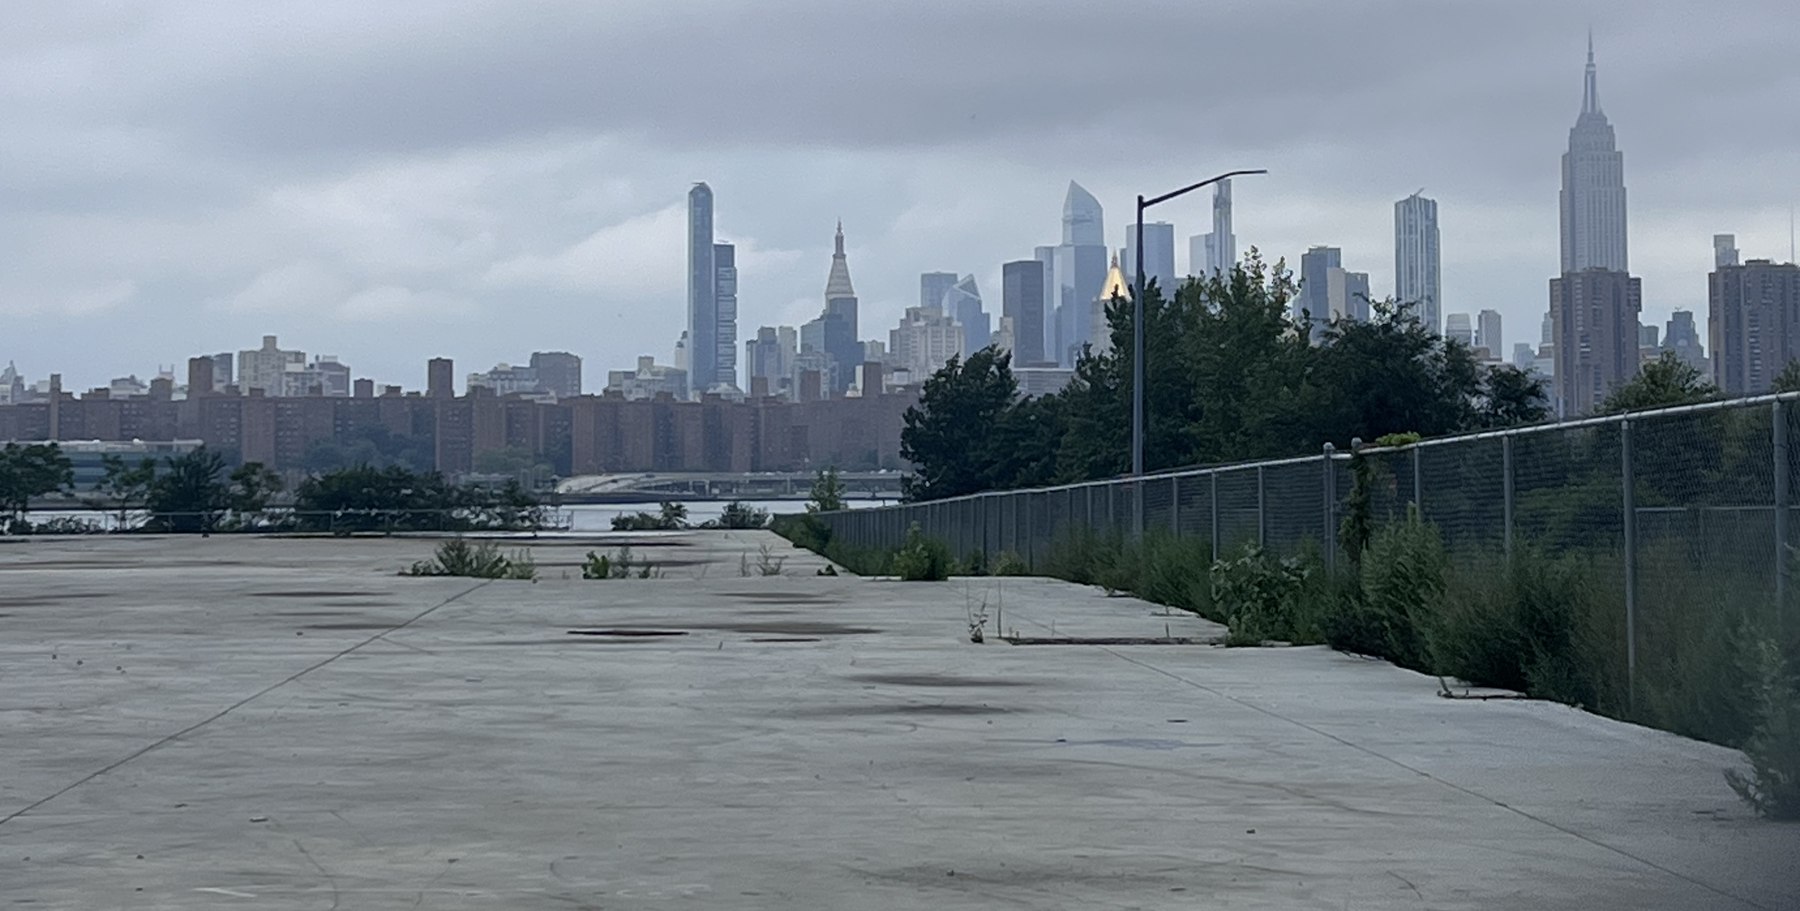
I recently moved to Williamsburg and was surprised by large waterfront lots sitting vacant between N 10th and N 14th Streets, right in front of my apartment. With so much development nearby, I was curious how this land could be seemingly ignored. It turns out there has been a plan for this land since 2005. That’s when Mayor Bloomberg made a deal to rezone the North Brooklyn waterfront. The plan allowed the building of luxury high-rise residential towers increasing land value for private owners and promised a waterfront park for the community on the exact lots that I was curious about (on the right in the first picture). Since then, the waterfront high-rises have been built. Yet, we still only have a portion of the promised 28-acre park in Bushwick Inlet Park.
It’s been two decades, what gives?
Scraping the minutes
Brooklyn Community Board 1 (CB1), the local advisory board for Williamsburg and Greenpoint, is the most relevant government body for this area. Every land use application has to come through CB1 for a public hearing and a recommendation before the city makes a decision. Lucky for me, CB1 posts its meeting minutes online. I created a script to scan the PDFs and build a dataset of the key data points for these meetings. The dataset covers all of CB1’s 110 meetings, 1,254 votes, and 1,369 speakers. Below we can see how often the term ‘waterfront’ shows up in these notes.
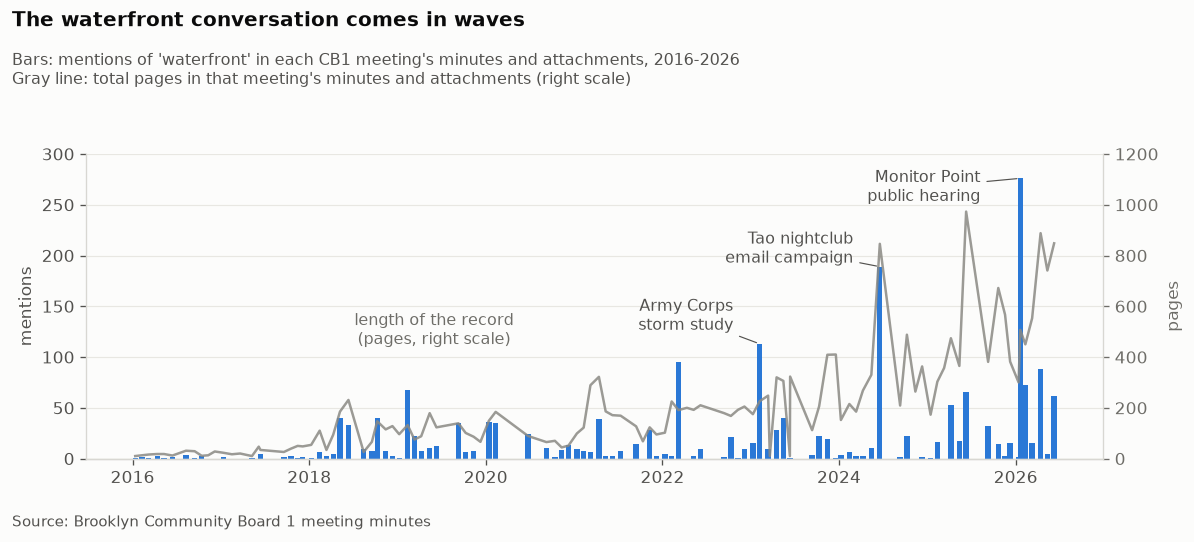
The term “waterfront” shows up frequently (the blue bars), with a few spikes in activity. These spikes generally get larger over time. The gray line signifies the length of meeting notes, which have also grown over the last decade. This is largely because the board office started binding testimony and correspondence into the record circa 2024. To get a sense of what actually happens in these meetings and the level of detail in the notes, here’s a summary of the latest two spikes:
January 20, 2026 — 276 “waterfront” mentions. This is a public hearing focused exclusively on Monitor Point. The notes are mostly written testimony from individuals and community groups including Veronica Zapasnik, a Polish immigrant who’s been in the neighborhood since 1990, and NYSAFAH (the New York State Association for Affordable Housing). The pro-park testimonies repeat one claim: the rezoning of this land into a set of residential towers breaks a two-decade-old promise to make it a waterfront park for all.
June 18, 2024 — 189 “waterfront” mentions. There is a swarm of emails to the board about the proposal to open a Tao nightclub next to Bushwick Inlet Park, including one template that was re-sent over 100 times. The template focuses on the habitat restoration at the Inlet and the noise pollution a club would bring.
Showing up - at the mic and in writing
The dataset of CB1 meetings measures the two main ways the community can voice their opinions: public speakers showing up physically to the board meetings and written testimony to the board. Public speakers are permitted at the board meetings after pre-approval for an allotment of 2-3 minutes per speaker. Alternatively, written testimony is accepted via email or letter. The actual letters and emails only show up in our dataset in volume in the last few years - more on that below.
I wanted to get a sense of which side shows up to speak vs how the board votes. Below we examine a few board votes through that lens.
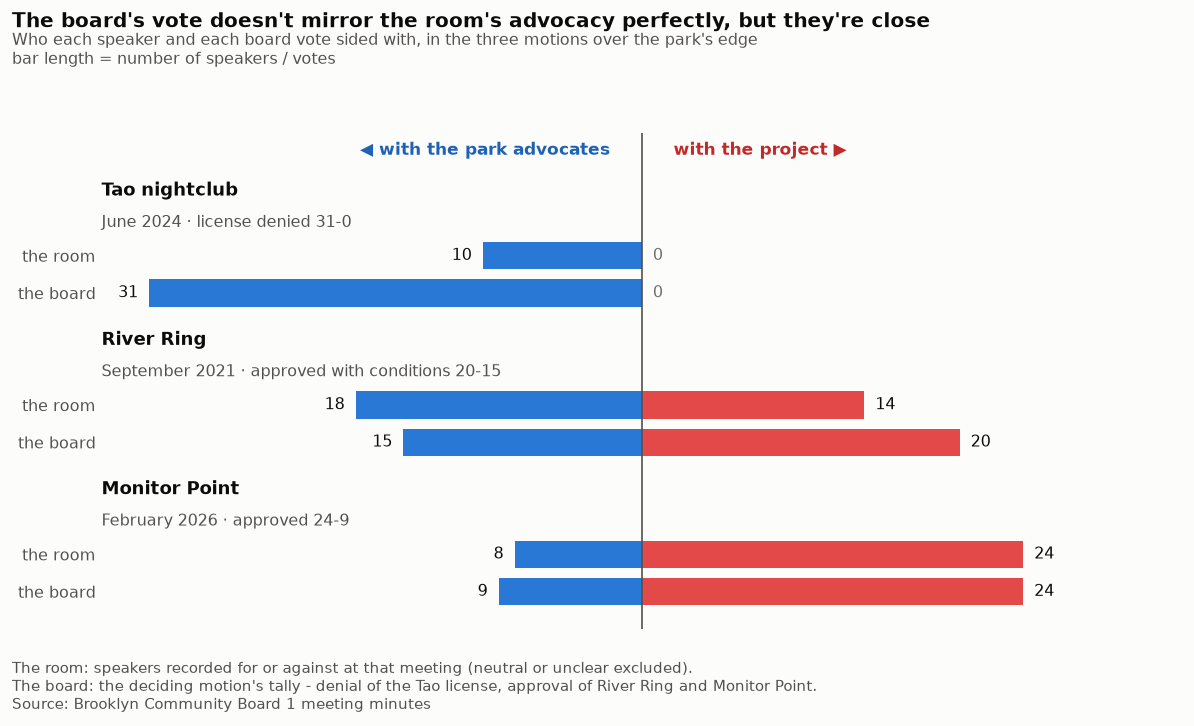
This chart zooms in on 3 board motions over the future of parks in North Brooklyn. Each motion has 2 corresponding rows: who spoke at the hearing, and how the board voted.
The board’s split tracks the room’s split but not perfectly. The park advocates’ one win (Tao nightclub) came when nobody showed up for the other side - ten speakers against and zero for it. The board denied the license 31-0. At Monitor Point the flow ran the other way: the project side filled the room 24-8, and the board landed at 24-9, almost the same ratio. River Ring is the only motion where the board varied from the room’s position but it was still close - the room was 18-14 against and the board 20-15 in favor.
This is a small sample, but it shows the board voting close to how the room splits. Even in River Ring, the one loss for the park advocates, the ratios are similar.
What about the letters?
Speaking at the mic isn’t the only way to reach the board, community members can write emails or letters to CB1. The meeting minutes bind these letters and emails into the public record. The minutes bind 1,707 letters and emails across the 110 meetings. 464 are the board’s own outgoing mail, which I exclude from this analysis. The remaining 1,243 pieces of incoming correspondence still cluster heavily in recent years - 72% land from 2024 on.
Below I create a similar visual to above but this time including mail. I used an LLM to classify each piece of written testimony as for or against the motion and match the letter to the motion it relates to. The 4 motions included below are the only 4 that are both relevant to CB1 and contain reasonable written testimony (a fifth, the Maiz license, drew only a handful of one-sided complaints about the venue’s noise - I left out).
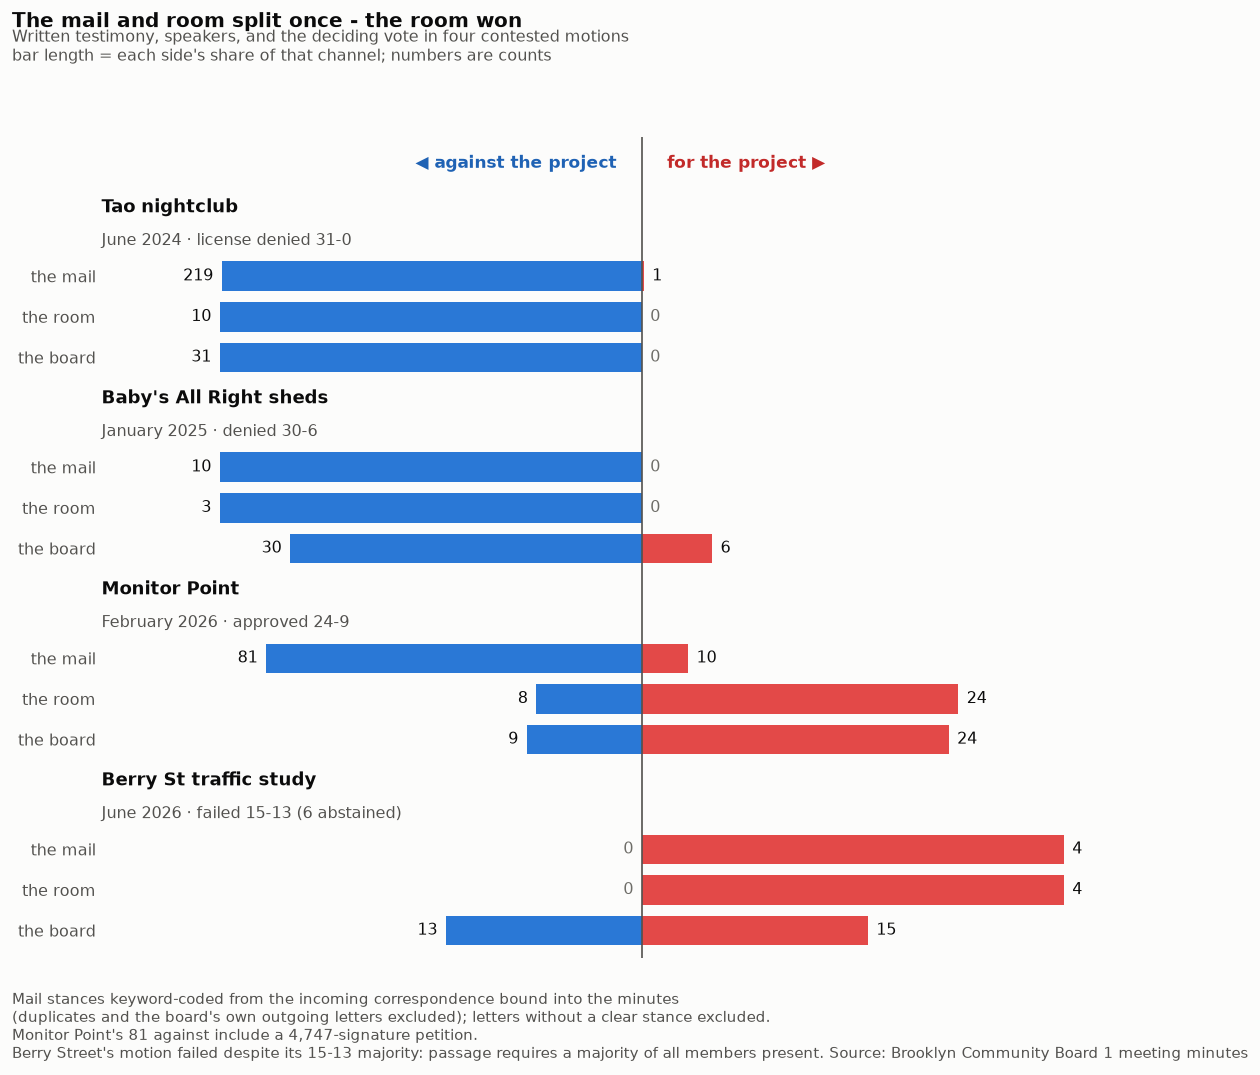
In the top two motions in the graphic above the letters, the mic, and the board all pointed the same way. For Tao, there were 219 emails against the nightclub, versus exactly one in favor (subject line: “Tao night club, yes please!”).
Monitor Point is the only motion where the advocacy channels split. I want to be careful about drawing conclusions from one data point. But this motion provides a clue to answer which channel is more important: mail or in-person advocacy. The mail ran 81-10 against the rezoning, including a 4,747-signature petition. The room ran 24-8 in favor - union locals and the developer’s own team filled the seats. The board went with the room, 24-9. The one time the mail and the mic disagreed, the board went with the voices in the room.
The Berry Street Traffic study is the only outlier in that the outcome went against both the speakers and the mail. The mail and mic were unanimous for the study, the board’s majority 15-13 went with the community, yet the motion still failed due to a technilcality.Passage requires a majority of all members present and voting and six board members abstained.
Does the room predict the vote?
These relationships are interesting, but not statistically rigorous. To draw a statistical conclusion we need more data points than the four motions with mail - so I dropped the limitation of focusing on written testimony or just waterfront votes. The below analysis just focuses on the impact of which way speakers advocate. The graph below charts the result of a regression predicting the board’s vote based on the ratio of public speakers’ advocacy for vs. against a motion. Each of the 21 points in the graph below compares the proportion of the room in favor of a motion with the proportion of the board’s votes in favor of it.
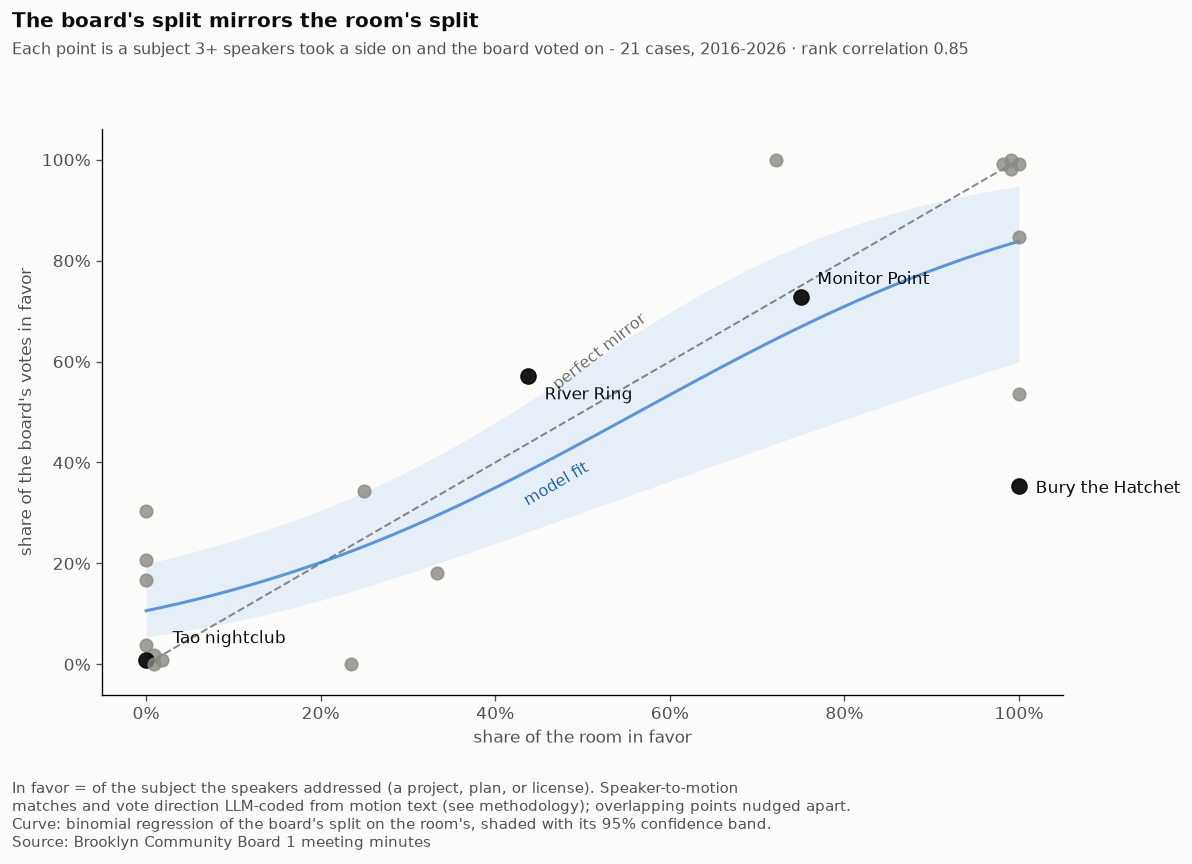
The rank correlation is 0.85, and in 19 of 21 cases the board’s majority landed on the same side as the room’s majority. Running a regression on these points: a room of speakers fully against a project is associated with 11% of the board voting in favor. A room unanimously in favor, roughly 84%. The confidence band is denoted by the blue band - given the limited dataset the band is failr large. I also ran a regression to see if the number of speakers present has any impact on the board’s vote, but there was no statistical evidence of an effect.
There are two outliers worth naming. River Ring had more of the board in favor than the speakers, but still the vote wasn’t far from the room’s ratio. The other is Bury the Hatchet, an axe-throwing bar. Three speakers advocated for it and nobody was against; the board denied the license 22-12. The CB1 minutes explain the situation: all three speakers on this motion were from the applicant’s own team, and the committee’s support was conditional on a letter from the neighboring block association that was never delivered. So this one wasn’t really a case of the board deviating from the community, but the board voting in favor of the community despite zero community presence.
An important statistical disclaimer: all of the above analysis discusses correlation, not causation. We do not have the ability to run experiments and understand the counterfactual. We cannot prove that speaker turnout caused a vote to turn out a certain way.
So what role can the community play in developing this land into a park?
This analysis largely focuses on one lever for prompting development in this park: community advocates working directly with their community board through mail or public speaking. I’d be tempted to say the park movement should just flood the community board with speaker requests in order to influence the board vote. However, given that the board pre-screens the speakers, this could just be a confounding variable: who the board permits to speak could be a predictor of how they are inclined to vote.
It’s also important to note one outcome we did not analyze: CB1 meeting minutes show conditions attached to the approvals that drew the most advocacy. A few examples from Monitor Point: the esplanade completion timeline, a certificate-of-occupancy condition tied to the promised Monitor Museum, and park maintenance money. I’ll dig into this in a future post to see if we can tie these conditions to specific speakers more widely.
Methodology
The dataset comes from the PDF meeting minutes CB1 posts publicly - 138 files covering 110 meetings from 2016 to 2026, about 22,000 pages. I extracted structured records (votes, liquor licenses, public speakers) with a custom ETL pipeline using LLMs hosted on AWS Bedrock. I created a verification framework and hand-verified a subset of data points from three sample meetings against the original PDFs: vote tallies matched 38 of 38, license records 144 of 144, and speaker recall was 97%. Every extracted record keeps a verbatim quote from the source PDF, so any claim in this post can be traced back to a page. One extraction gap surfaced during this analysis - the September 2021 roll-call section, including the River Ring votes, had been misfiled as an attachment. I recovered it by hand from the minutes text, with the fix documented in the dataset.
Two disclaimers:
- Everything stated above is association, not causation: big projects generate both turnout and division, and this data can’t say which causes which. The mirror-chart regression comes with a wide confidence band at 21 points, and its speaker-to-motion matches were coded by Claude Code from the motion text as part of the ETL, not hand-verified.
- Letters and emails are split out of the minutes’ attachment pages by an LLM pass; the full dataset ships with the repo (data/mail_items.jsonl - one record per item with a 1,200-character window, email addresses redacted). This replaced an earlier regex splitter that undercounted, especially before 2024 where scans and looser formatting hid roughly two-thirds of the mail. Duplicates and the board’s own outgoing letters are excluded from all counts. Stances are keyword-coded with negation handling; when a letter argues both directions, the earlier match wins - writers lead with their stance. Every letter counted as “for” in the four charted motions was read and confirmed, along with every keyword-unclear item and a 25-letter sample of the against class (zero errors); the confirmations are documented in data/mail_adjudications.jsonl. Letters without a clear stance are excluded from the tallies. Correspondence is only bound into the minutes in volume from about 2024, so pre-2024 mail counts are best read as floors.
The full pipeline, analysis notebooks, and the extracted dataset are on GitHub: blowenstein0/cb1-minutes-analysis.